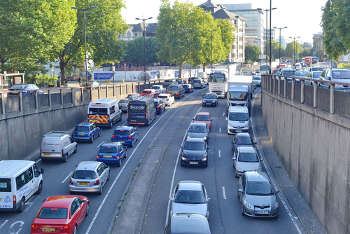
Traffic on Britain’s roads reached yet another all-time high last year, with car, van and lorry use all increasing but bus mileage continuing to fall.
According to the Department for Transport’s (DfT) Road Traffic Estimates: Great Britain 2017, 327.1 billion miles were driven on UK roads in 2017, a 1.3% increase from 2016.
Traffic on rural roads had the highest increase at 12.8% over the last five years, possibly reflecting ongoing cuts to public transport. While urban ‘A’ road traffic has been ‘fairly steady’ over the last five years, there has been an increase of 3.7% in the miles driven on urban minor roads.
Officials said car and taxi use increased to a new high, rising by 1.1%, to 254.4 billion vehicle miles (bvm) in 2017.

However, van traffic had the fastest growth in percentage terms, rising 2.7% to 50.5 bvm and now accounting for 15% of all motor vehicle traffic - due to in part to the increasing popularity of online shopping.
Bus and coach traffic saw the largest decrease of any vehicle type, falling by 3.4% since 2016 and more than one-quarter (28%) in the last decade.
Mileage on motorcycles and scooters fell slightly (2.8 million bvm, down 0.3%) , while 3.3 billion miles were ridden on pedal cycles in 2017. This was 3% further than in the previous year, and almost 30% more than 20 years ago.
In 2017, 68.7 billion vehicle miles were travelled on Great Britain’s motorways, 10% more than 10 years ago.
Howard Robinson, chief executive of the Road Surface Treatments Association, said: ‘As traffic levels increase, so do the demands being placed on an under-funded road network.
‘The lack of adequate assured funding for local road maintenance has resulted in a network where one in five roads, a significant 20%, may need replacing by 2023 – and that is just to cope with current traffic levels.’
He added: ‘The Government’s own figures show how the vast majority of traffic uses the local road network. They underline the need for greater investment in long-term programmes of preventative road maintenance rather than expensive patching-up.’
As traffic has grown, the risk of fatality or injury in a road accident has fallen almost every year according to the report. Officials suggested that improvements in areas such as education, vehicle technology, highway engineering and road safety policies have contributed.
The DfT also stated: ‘CO2 emissions from road transport fell by 4.3% between 2000 and 2015, despite a 9.3% rise in vehicle miles travelled over the same period.’
Nitrogen oxides and PM10 pollution also fell in this time.
Officials attributed this decrease to improvements in fuel efficiency and ultra-low emissions vehicles. The number of newly registered ultra-low emissions vehicles in 2017 was 53,195 (1.7% of all newly registered vehicles) compared to 4,314 in 2013.
Five busiest road sections in 2017 (vehicles per day)
1. M25 J14-15 211,000
2. M25 J15-16 203,000
3. M25 J13-14 195,000
4. M60 J12-13 184,000
5. M25 J12-13 184,000


