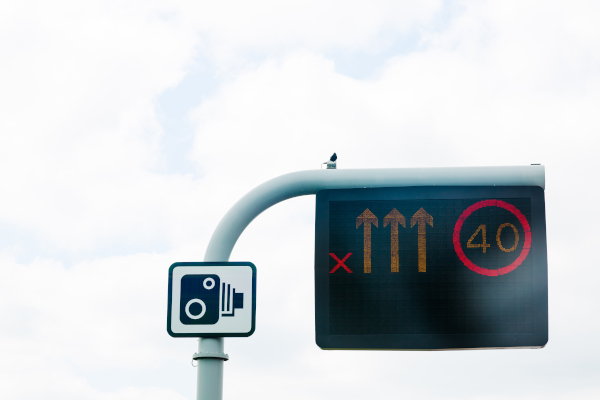
National Highways currently has no accurate system for monitoring general compliance with 'Red X' lane closure signs on smart motorways, Highways can reveal.
The national operator often cites the statistic that Red X compliance is over 90% but has conceded to Highways that following a technology upgrade it is currently in limbo between systems and cannot provide current data.
National Highways measures Red X compliance 'as the percentage of all vehicles, across all lanes, where a driver... has passed the closure in an open lane'.
Red X % compliance = ((V in Lane 2 + V in Lane 3) / (V in Lane 1 + V in Lane 2 + V in Lane 3) x 100. In this example V represents the total number of vehicles counted in each lane by the sensors in the carriageway.
This boosts the actual 'compliance' percentage by counting all the vehicles in other lanes as automatically being actively 'compliant' - rather than simply representing normal traffic patterns.
The most accurate methodology would almost certainly be to monitor the percentage of vehicles actively moving out of the closed Red X lane, and to provide some benchmark against historical traffic flow in order to account for people that didn't move into a Red X lane.
Under the National Highways system, there was just over 90% 'compliance' when it ran tests in the East and Southeast regions from the start of September 2021 to the end of August 2022, and again in a second set of tests from September 2022 to the end of August 2023'.

Graph above shows for the Southeast region
This is the last period for which there is accurate data.
The results provided by National Highways (shown for Southeast region above) suggest tens of thousands of drivers drove through the closed Red X lanes during each month of the testing period based on an average 10% non compliance from the hundreds of thousands of total detections in a given month (ranging from 250,000 to around 800,000 in a single month).
There was little change from one year to the next in terms of compliance, 0.5% in the East region and -0.67% in the Southeast, and fluctuations of between 6% to 11% non compliance between the months. The testing measured between around 25,000 hours of Red X settings and 32,000 hours.
In response to an FOI, National Highways said: 'National Highways recognises the vital role that compliance data plays in shaping initiatives aimed at improving road safety.
'As part of this effort, a previous proof of concept project developed a tool to monitor Red X compliance on smart motorways. The tool was designed to read data from the traffic management control system in use at that time. However, as new systems have been implemented, our ability to analyse compliance using this tool has decreased. The most recent data, from September 2023, covers the East and Southeast regions, the only areas still using the older system.
'We confirm that there is no report showing further evidence on Red X compliance using the CMT tool.
'National Highways has now initiated work to transform this proof of concept into an operational tool that will regularly provide Red X compliance data across smart motorways. Data from the new tool will be used to guide future compliance-improving activities, including targeted campaigns in partnership with the police.'
National Highways' monitoring system for Red X compliance is seperate from the enforcement system used by the police, which uses cameras to ensure drivers comply with lane closures.


